논문 제목: A joint analysis of single cell transcriptomics and proteomics using transformer
출판연도: 2025년 1월
학회/저널: npj Systems Biology and Application(Nature Publishing Group)
Abstract
CITE-seq은 단일 세포 수준에서 RNA 발현량과, 단백질 발현량을 동시에 측정할 수 있는 강력한 방법이지만, 높은 실험 비용이 발생한다는 한계를 지니고 있다. 따라서, 본 논문에서는 scTEL이라는 새로운 딥러닝 프레임워크를 제안한다.
scTEL은, transformer encoder layers에 기반하였고, 시퀀싱된 RNA 발현으로부터, 같은 세포 내의 unobserved protein 발현을 mapping하기 위해 고안되었다.
- scRNA-seq data를 활용해 protein expression 예측
- integrate multiple CITE-seq datasets
Introduction
scRNA-seq과 같은 mono-omics 리서치는 분자 hierarchy를 완전히 밝혀내기에는 부족하다. 따라서 단일 세포 수준에서 multi-omics 접근이 필수적이다. 한 예시로, CITE-seq는 단일 세포 수준에서 mRNA 시퀀싱과 표면 단백질 프로파일링을 동시에 진행하는 방법인데, 최근 세포생물학에서 여러 중요한 발견들을 촉진하였다.
하지만, CITE-seq는 높은 실험 비용, 동시에 측정될 수 있는 표면 단백질 범위의 제한, RNA와 표면단백질 발현 수준간의 상관관계 부족 등 여러 challenges를 가지고 있다. 이렇나 한계를 극복하기 위해 여러 computation based 접근이 제안되었다. 이러한 접근들은 단일 세포 수준에서 RNA와 protein 발현간의 관계를 추론하기 위해 제안된 것으로, 제안된 이유는 scRNA-seq 데이터로부터 단백질 발현이 정확히 매핑될 수 있다면, 위의 challenges들이 해결될 수 있기 때문이다.
예시로 Seurat, totalVI가 존재하는데, 둘다 주어진 scRNA-seq 데이터셋으로부터 표면 단백질 레벨을 예측할 수 있다. 하지만, 이 방법들도 단점이 존재하는데, 바로 batch effects가 여전히 존재한다는 것이고, totalVI의 경우는 데이터 분포와 구조를 '가정'하고 있어서, 실제 데이터와의 차이가 존재할 수 있다는 점이 존재한다.
따라서, deep learning 프레임워크가 등장하기 시작했는데, 대표적인 예시로 sciPENN이 있다. 이는 RNN을 사용한 구조인데, RNN은 시퀀스 데이터에서 처음 디자인되었다는 점에서 expression matrix data를 모델링하기에 아주 적합하지 않다는 한계가 있으며, RNN 자체의 한계(gradient vanishing)도 존재한다.
본 논문에서는 transformer에 영감을 받아, transformer encoder layers + LSTM cells 를 결합한 새로운 프레임워크 scTEL을 제안하며, 이는 CITE-seq에서 transcriptomics, proteomic data를 jointly model할 수 있다.
- transformer encoder layers; attention mechanism => extract embedding info from gene expression data, capture relationships among genes (vs. sciPENN에서는 linear layers 사용하므로 이러한 관계 포착 X)
- LSTM 구조 => enable multi-task framework
Methods
Datasets and normalization

데이터셋
- PBMC
- MALT
- Monocytes
- H1N1
이 데이터셋들은 각각 다른 시퀀싱 플랫폼을 사용해서 시퀀싱됨
많은 최근 연구들에서 해당 데이터셋을 벤치마크로 사용했기 때문에 본 논문에서도 똑같이 함
normalization: input 이전 작업
- RNA genes, proteins expression matrix 각각에 대해 정규화 진행
- UMI normalization: 세포마다 다른 library size를 보정해, 공정하게 세포 간 발현량을 비교할 수 있게 해주는 과정
- Scanpy 사용
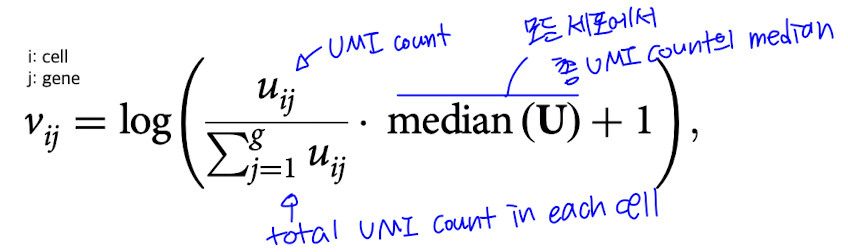
이후, 각 발현량의 평균이 0, 표준편차가 1이 되도록 z-score normalization 진행
scTEL architecture
Overview

가장 중요한 scTEL의 목표: mapping from the RNA expression matrix to protein expression at the single-cell level
1. 여러 CITE-seq 데이터셋에서, 모든 데이터셋의 common genes, 즉 교집합으로 통합
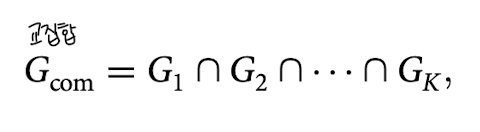
2. 위의 common genes에서, top 1000 HVGs(highly variable genes) 선택 -> input features!
3. embedding layers -> transformer encoding layers -> LSTM cells를 거쳐서 integrated protein expression matrix를 output! (이때 모든 데이터셋에서 공통으로 등장하는 단백질 + 개별데이터셋에만 있는 단백질까지 포함하는, 즉 합집합 통합 행렬 출력)

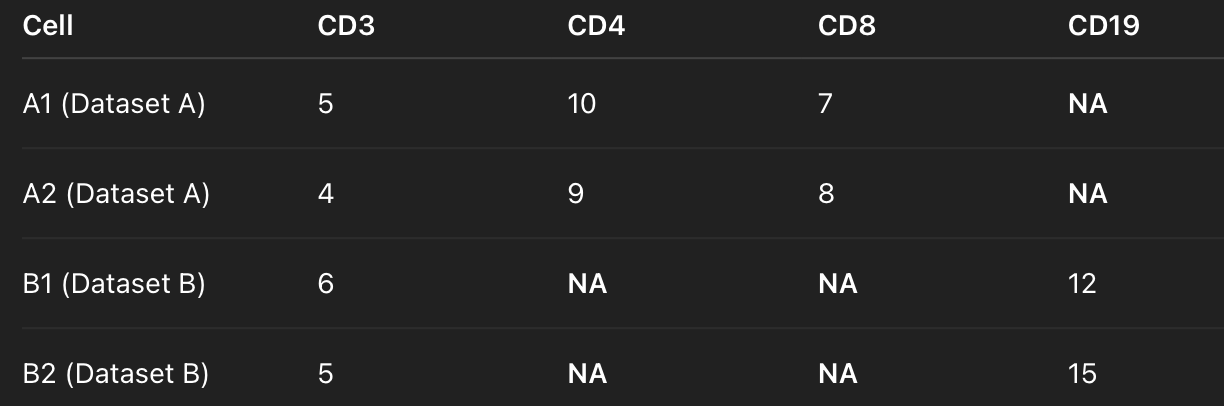
어떤 단백질은 아예 ground truth 값(실제 측정값)이 없으므로, 즉 정답이 없는데, 정답이 없는 칸에 대해서까지 loss를 계산하면 잘못된 학습을 하게 되므로, 해당 빈칸은 loss 계산에서 제외
Multi-tasks
각 테스크별로 알맞는 모델을 썼던 기존과 달리, scTEL은 여러 테스크를 모두 수행할 수 있는 joint analysis framework를 제공한다. Protein expression prediction, cell type identification, data integration은 서로 correlated되어있는데(Effective data integration surely helps cell type identification, and further improves the accuracy of protein expression prediction.), 이러한 관계를 포착하기 위해 scTEL은 shared embedding features에 기반하여 다양한 outputs을 생성한다.
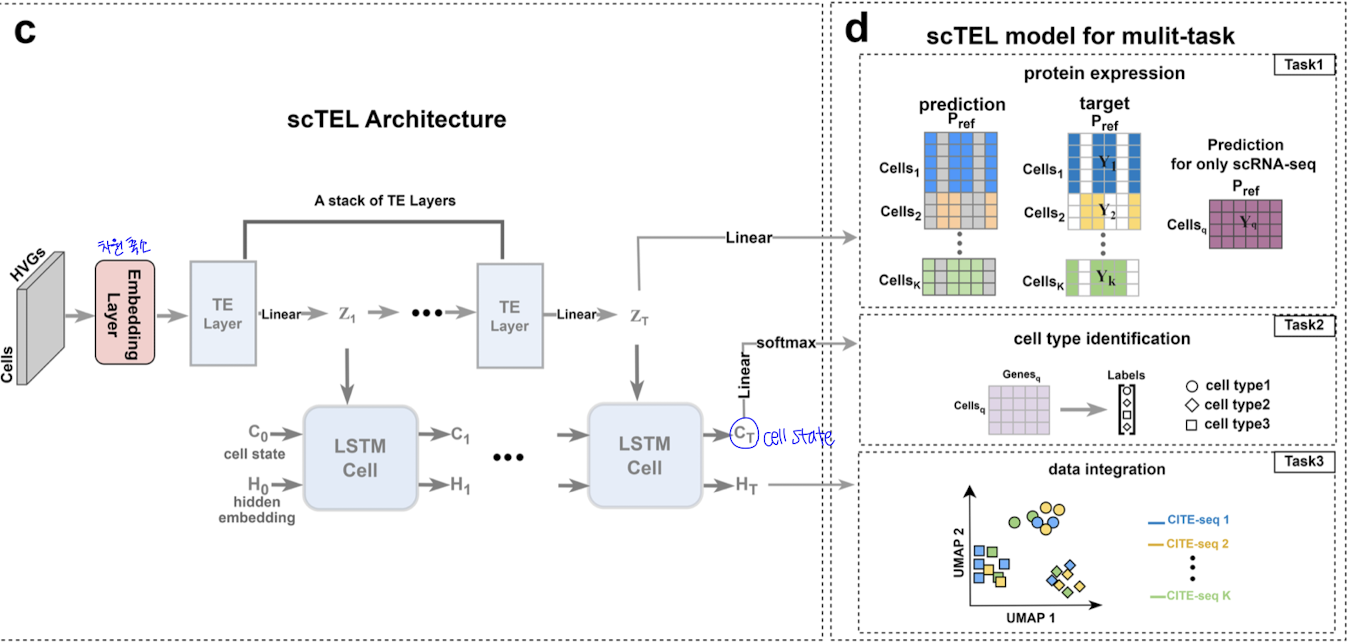
embedding layer: 차원 축소
stack of TE layers
- gene expression 행렬에서 embedded features 생성
- 중간 representations 생성
- gene expression data안에서의 interaction, 관계 capture (vs. sciPENN: simple linear layers여서 관계 포착 X)
- TE layers의 output인 intermediate matrices Z_tsms LSTM cells의 input으로 들어감
LSTM cells
- cell state C_T: used to predict the cell type through linear layers
- hidden embedding H_T: 세포의 low dimensional representation

Loss function
Task 1: protein expression predictions - regression problem
MSE 사용
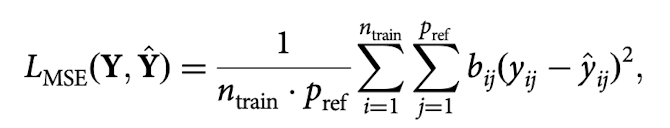
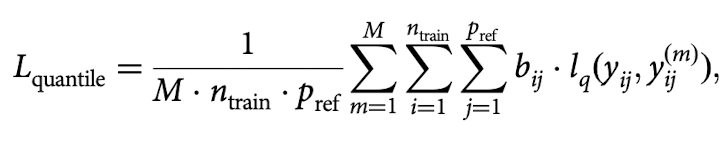
quantile loss function
- uncertainty of the estimation
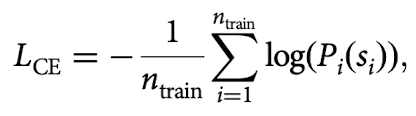
Task 2: cell type identification - classification task
categorical cross-entropy(CE) loss function 사용
Total loss function
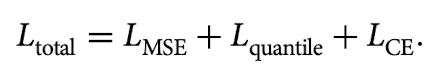
전체 loss를 최소화함으로써, scTEL은 3개의 서로 다른 테스크 간 커넥션을 더 효율적으로 포착할 수 있게 된다.
Results
4개의 public CITE-seq 데이터셋(PBMC, MALT, H1N1, Monocytes)
3개의 downstream tasks (data integration, protein expression prediction, cell type identification)
Seurat, totalVI, sciPENN과 비교
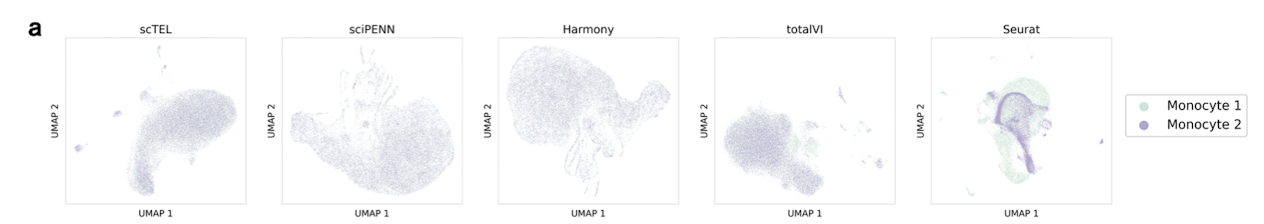
Data integration and low-dimensional representation

UMAP을 활용한 batch effects 시각화
- dimension reduction이후, UMAP 공간 상에서 각 세포를 plot -> 각 batch label에 따라 colored
⇒ if batch effects 존재: 서로 다른 배치들이 "분리"되어 클러스터링
⇒ if batch effects 성공적인 완화: 서로 다른 배치들이 섞여있음 (intermingle)
Monocytes dataset: scTEL, sciPENN이 data mixing이 잘 되어있는 것을 볼 수 있음 (batch effect↓)
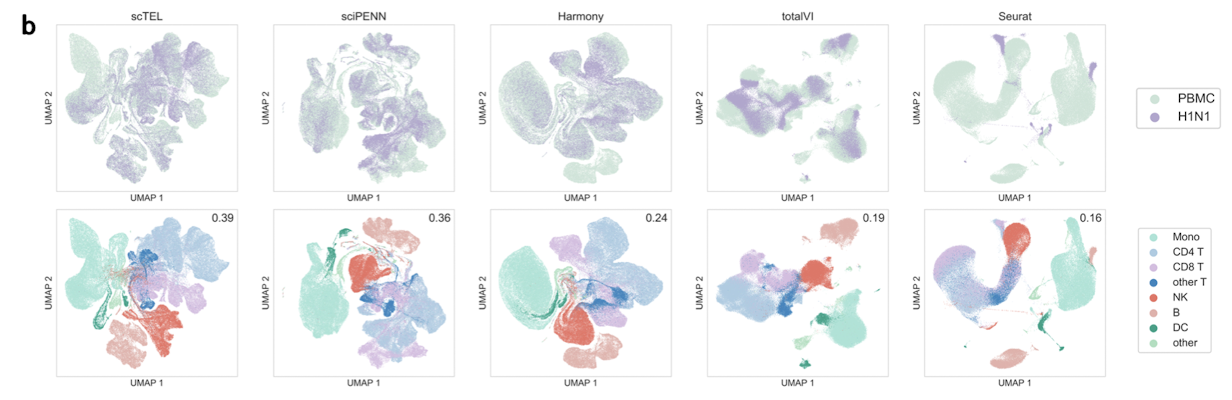
PBMC + H1N1 dataset 통합: 각각 다른 실험실로부터 온 데이터임에도, scTEL에서 데이터들이 잘 mix되어있음; scTEL은 분명하고 뚜렷한 clustering을 유지한 채, 서로 다른 데이터셋을 잘 mix함.
PBMC + MALT dataset 통합: only scTEL만 잘 mix함 ; scTEL은 분명하고 뚜렷한 clustering을 유지한 채, 서로 다른 데이터셋을 잘 mix함.

또한, b,c에서 scTEL이 가장 높은 Sihouette score달성. (clustering quality 평가)
Protein expression prediction

scTEL은 아래 두 가지 가능
- CITE-seq 데이터: 일부 단백질만 측정됨 → 측정 안 된 단백질 발현을 보완(impute)
- scRNA-seq 데이터: 단백질은 아예 없음 → 모든 단백질 발현을 예측(predict complete protein expression)
RMSE, Pearson correlation 사용해서 predicted, target protein expression levels 간 차이 계산
아래는 각 모델별로, 각 protein의 RMSE box plot
모든 protein에서 scTEL이 가장 낮은 average RMSE를 보임

아래는 Monocytes에서 6 overlapping marker proteins의 expression level 시각화 결과
scTEL 결과가 truth가 가장 근접
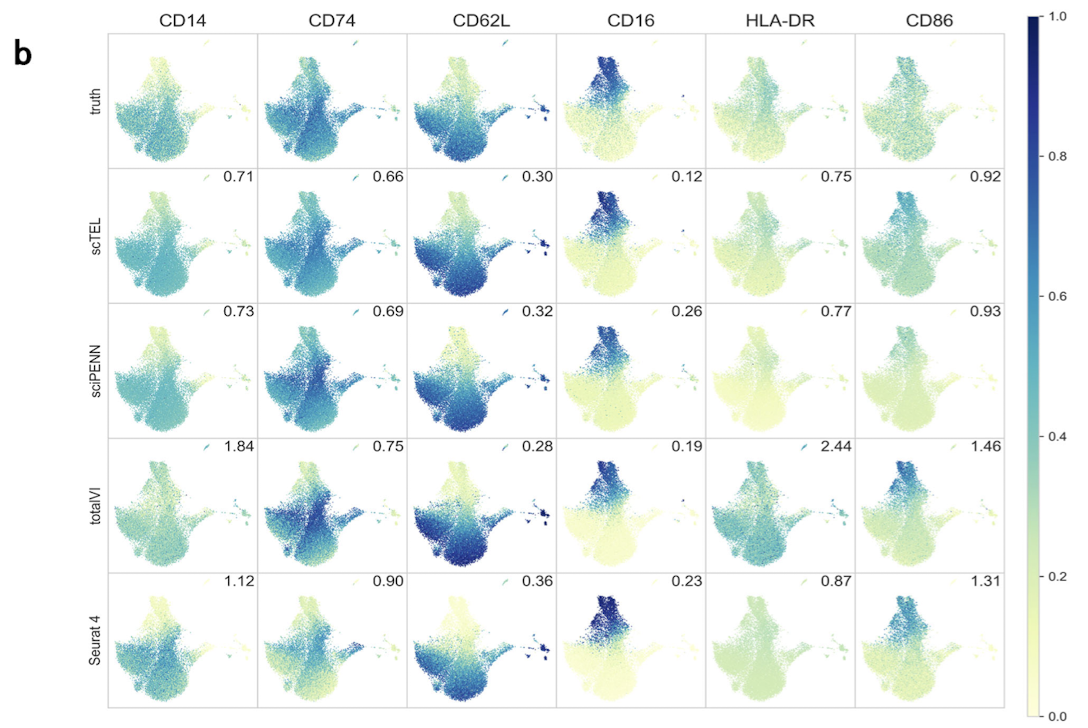
⁉️ 수치적으로 sciPENN과 별로 차이가 안나는 것처럼 보이는데, 이걸 과연 유의미하다라고 볼 수 있는지?
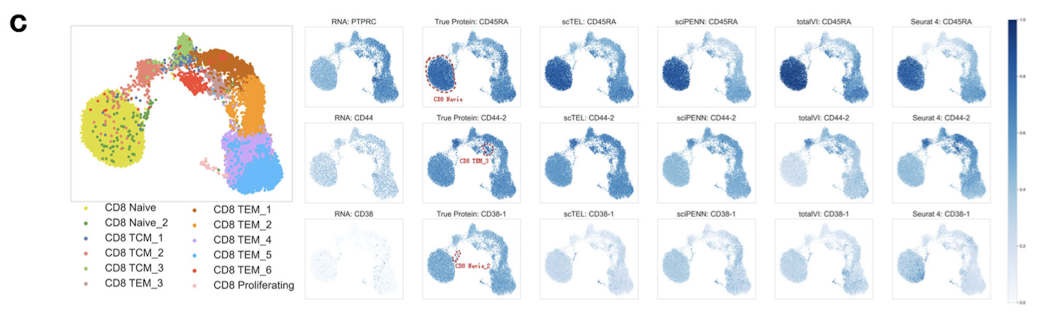
PBMC 데이터셋에서 protein expression에 따른 대응하는 gene expression
PBMC에서 RNA발현만 단독으로 분석하면 cell subpopulation을 뚜렷하게 구분하기 어렵다.
여기에 단백질 발현 데이터를 추가하면 세포 아형을 더 잘 구분할 수 있는데, 특히 특정 cell subpopulation을 나타내는 marker protein 발현 패턴이 RNA보다 더 분명하게 나타난다. CD8 세포의 3개의 cell subpopulation에서, 아래와 같이,
- Naive CD8: marker protein = CD45RA, 대응 RNA = PTPRC
- TEM3: marker protein = CD44-2, 대응 RNA = CD44
- Naive2: marker protein = CD38-1, 대응 RNA = CD38
- UMAP 상에서 단백질 발현을 보면, 각 subpopulation이 확실히 드러난다.
즉, RNA만 보면 cell subpopulation이 잘 안보이는데, 실제 단백질 데이터(true protein)은 cell subpopulation 구분에 매우 효과적임. -> scTEL은 예측한 단백질 발현 패턴이 실제와 거의 유사해서, RNA만 있는 데이터에서도 단백질 발현을 추정, 예측해서 cell subpoluation을 정확히 식별 가능
Pearson correlation(fig.5)도 마찬가지로, scTEL이 다른 모델보다 예측 정확도(상관계수)와 신뢰도(커버리지 확률) 모두에서 안정적이고 우수한 성능을 보임을 보여준다.
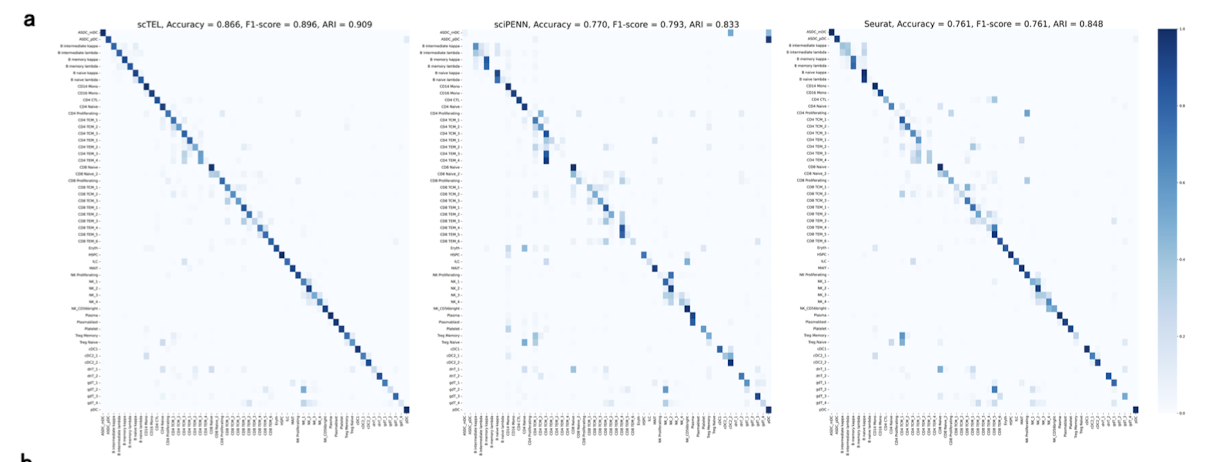
Cell type identification
몇몇 rare subtypes의 경우는, RNA expression에만 의해서 구별되지 않을 수 있다. scTEL은 RNA와 단백질 발현 데이터를 모두 활용함으로써 classification 정확도를 높였는데, PBMC 데이터셋을 활용해서 평가한 결과, 아래 confusion matrix에서 볼 수 있다시피 scTEL은 86.6%로, 다른 방법들보다 높은 정확도를 보였다.
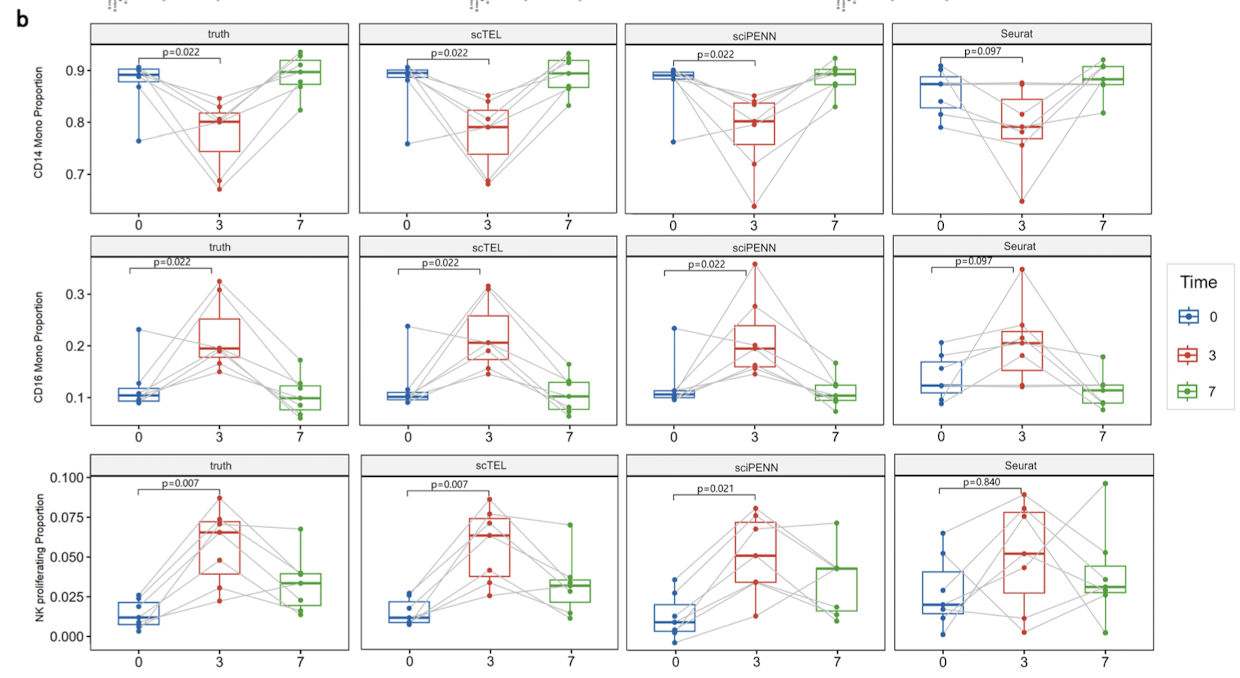
PBMC 데이터셋의 기증자들은 VSV 기반 HIV 백신을 접종받았는데, 접종 직전, 접종 3일 후, 7일 후 세 시점에서 세포 발현 프로파일을 수집하였다. 선행연구에 따르면, CD14 monocytes, CD16 monocytes, NK proliferating 세포가 백신에 뚜렷한 반응을 보인다고 보고되었는데, 시간 경과에 따른 subtypes의 비율 변화 결과, scTEL이 실제 패턴과 가장 유사하게 예측하였다.
Discussion
proteomics 리서치는 높은 비용, 기술적 한계로 인해 often challenging
(따라서 scRNA-seq data로부터 단백질 발현을 예측, 매핑할 수 있으면 좋을 것)
scTEL 요약
- model RNA and protein expression jointly at single-cell level
- mapping from sequenced RNA expression to the unobserved protein expression within the same cells
- lower cost
- data integration, protein expression prediction, cell type identification 3가지 task에서 scTEL이 전통적인 방법보다 뛰어남을 확인
scTEL 한계
- 복잡한 deep learning framework -> high computational resources
- relies on well-annotated single-cell datasets (ex. PBMC) -> ⭐️
향후 방향
- metabolomics, epigenetics와 같은 추가적인 오믹스 데이터 통합
